开启nginx_stub_status模块
cat status.conf
server {
    listen       81;
    server_name  localhost;


    location / {
        root   /usr/share/nginx/html;
        index  index.html index.htm;
    }
    location /nginx_status{
    allow 127.0.0.1;
    deny all ;
    stub_status  on;
    access_log    off;
    }

    error_page   500 502 503 504  /50x.html;
    location = /50x.html {
        root   /usr/share/nginx/html;
    }

}


nginx -t
nginx -s reload

curl 127.0.0.1:81/nginx_status
Active connections: 1
server accepts handled requests
 2 2 2
Reading: 0 Writing: 1 Waiting: 0
nginx-prometheus-exporter
[root@four ~]# mkdir /data/nginx_exporter
[root@four ~]# tar -xf nginx-prometheus-exporter_1.3.0_linux_amd64.tar.gz -C /data/nginx_exporter/
[root@four nginx_exporter]# nohup ./nginx-prometheus-exporter -nginx.scrape-uri http://127.0.0.1:81/nginx_status &
[root@four nginx_exporter]# curl 127.0.0.1:9113/metrics  #可以查看到监控的数据
配置prometheus
  - job_name: "nginx_exporter"
    scrape_interval: 15s
    scrape_timeout: 5s
    static_configs:
      - targets: ["39.105.128.155:9113"]

[root@five prometheus]# curl -X POST http://localhost:9090/-/reload
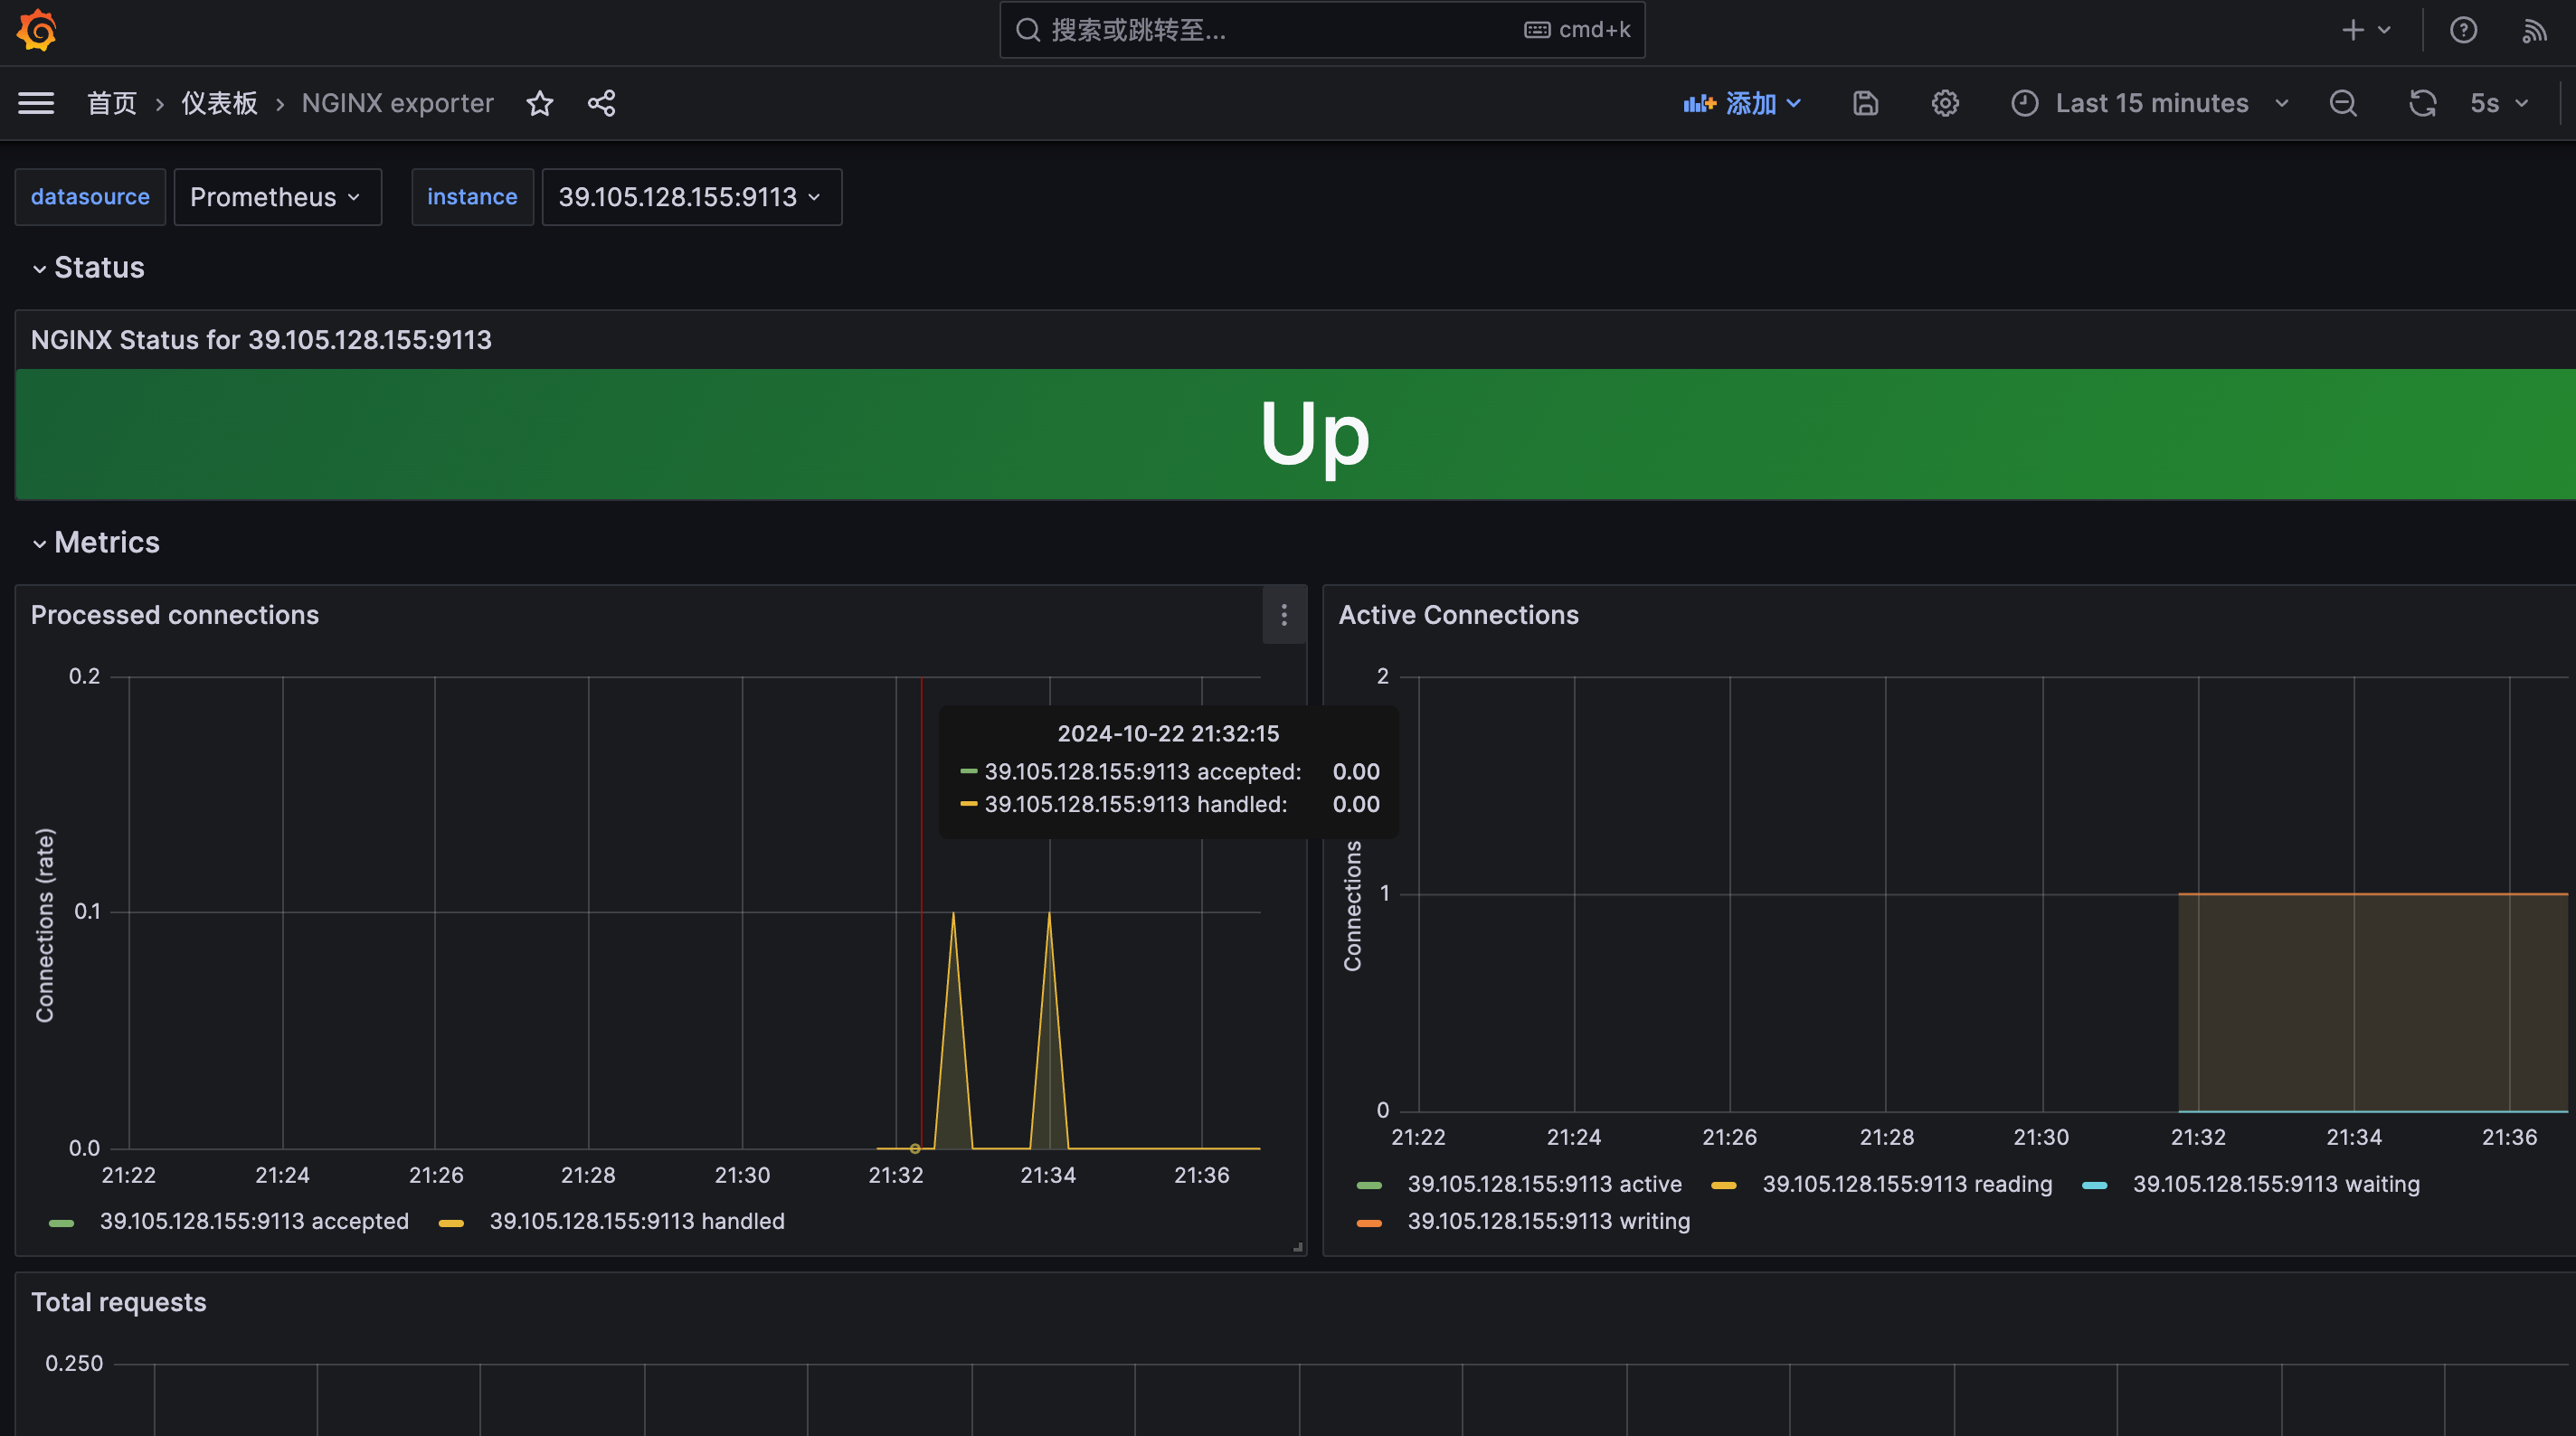
配置grafana
直接导入代码12708