使用容器化构建Prometheus监控系统优势
简化部署:使用容器可以快速部署Prometheus,减少了部署和配置的复杂度。
灵活性:容器可以在任何平台上运行,包括云、物理机等。
可扩展性:容器化的Prometheus可以轻松地扩展到多个节点和实例,以满足不同规模和性能要求。
一致性:容器化的Prometheus可以确保在不同环境和平台上的一致性,避免了由于环境不同而导致的问题。
安全性:容器可以提供更好的安全性,包括隔离、容器间通信的控制、镜像签名和验证等。
可移植性:容器化的Prometheus可以轻松地在不同环境中移植,从而降低了迁移和升级的成本和风险。
准备容器运行时 Docker
Docker安装YUM源准备
使用阿里云开源软件镜像站。
# wget https://mirrors.aliyun.com/docker-ce/linux/centos/docker-ce.repo -O /etc/yum.repos.d/docker-ce.repo
Docker安装
# yum -y install docker-ce
启动Docker服务
# systemctl enable --now docker
容器化构建Prometheus监控系统
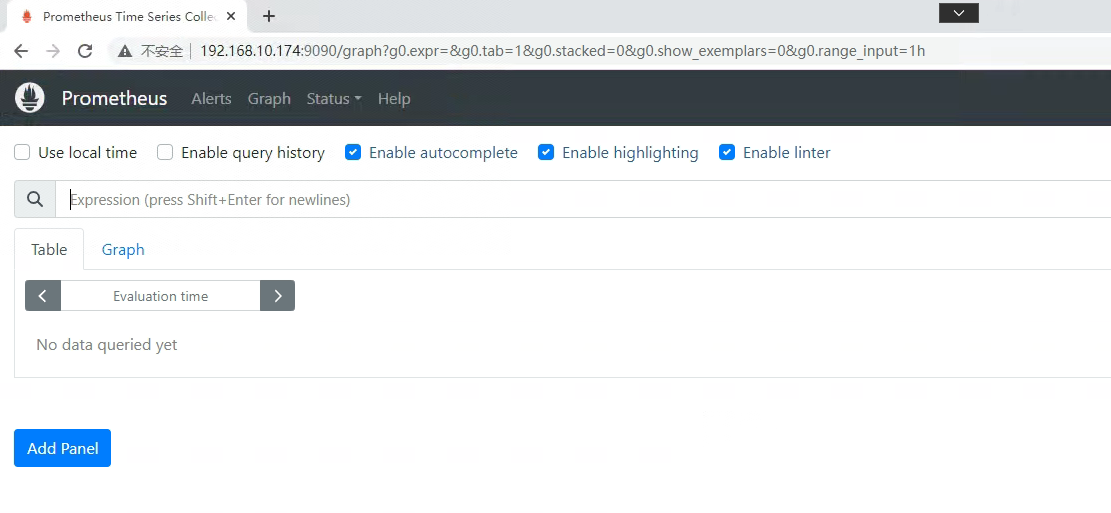
部署Prometheus
创建持久存储目录
[root@monitorhost ~]# mkdir -p /opt/prometheus/config
[root@monitorhost ~]# mkdir -p /opt/prometheus/data
[root@monitorhost ~]# mkdir -p /opt/prometheus/rules
准备prometheus.yml文件
[root@monitorhost ~]# vim /opt/prometheus/config/prometheus.yml
[root@monitorhost ~]# cat /opt/prometheus/config/prometheus.yml
# my global config
global:
  scrape_interval: 15s # Set the scrape interval to every 15 seconds. Default is every 1 minute.
  evaluation_interval: 15s # Evaluate rules every 15 seconds. The default is every 1 minute.
  # scrape_timeout is set to the global default (10s).

# Alertmanager configuration
alerting:
  alertmanagers:
    - static_configs:
        - targets: ['192.168.10.174:9093']
          # - alertmanager:9093

# Load rules once and periodically evaluate them according to the global 'evaluation_interval'.
rule_files:
  # - "first_rules.yml"
  # - "second_rules.yml"
  - "/usr/local/prometheus/rules/*.yml"

# A scrape configuration containing exactly one endpoint to scrape:
# Here it's Prometheus itself.
scrape_configs:
  # The job name is added as a label `job=<job_name>` to any timeseries scraped from this config.
  - job_name: "prometheus"

    # metrics_path defaults to '/metrics'
    # scheme defaults to 'http'.

    static_configs:
      - targets: ["192.168.10.174:9090"]

  - job_name: "node_exporter_otherhost"
    static_configs:
      - targets: ["192.168.10.175:9100"]
使用docker运行Prometheus
docker run -d \
--privileged=true \
-u root \
--restart=always \
-p 9090:9090 \
-v /opt/prometheus/config/prometheus.yml:/etc/prometheus/prometheus.yml \
-v /opt/prometheus/data:/prometheus \
-v /opt/prometheus/rules:/usr/local/prometheus/rules \
prom/prometheus:latest \
--storage.tsdb.retention.time=100d \
--config.file=/etc/prometheus/prometheus.yml
[root@monitorhost config]# docker ps
CONTAINER ID   IMAGE                    COMMAND                   CREATED          STATUS          PORTS                                       NAMES
bf65c67833bb   prom/prometheus:latest   "/bin/prometheus --s…"   35 seconds ago   Up 35 seconds   0.0.0.0:9090->9090/tcp, :::9090->9090/tcp   recursing_brattain
部署Grafana
创建持久存储目录
[root@monitorhost ~]# mkdir -p /opt/grafana/data
[root@monitorhost ~]# chmod 777 /opt/grafana/data
使用docker运行Grafana
docker run -d \
-p 3000:3000 \
--name grafana \
-v /opt/grafana/data:/var/lib/grafana \
-v /etc/localtime:/etc/localtime \
grafana/grafana:latest
[root@monitorhost ~]# docker ps
CONTAINER ID   IMAGE                    COMMAND                   CREATED          STATUS          PORTS                                       NAMES
21fb83ee6e55   grafana/grafana:latest   "/run.sh"                 14 seconds ago   Up 13 seconds   0.0.0.0:3000->3000/tcp, :::3000->3000/tcp   grafana


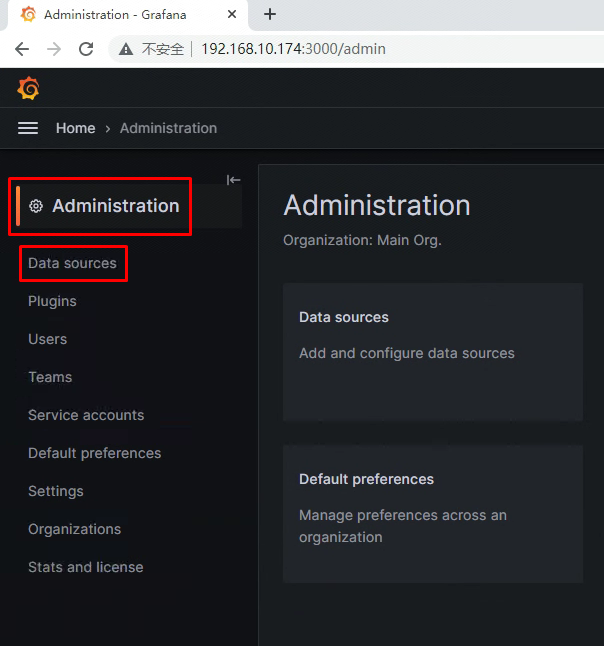
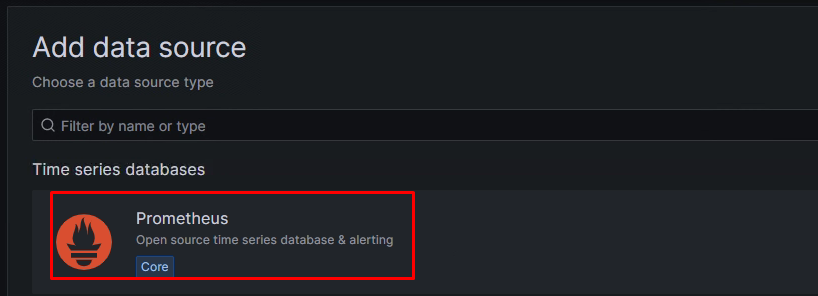
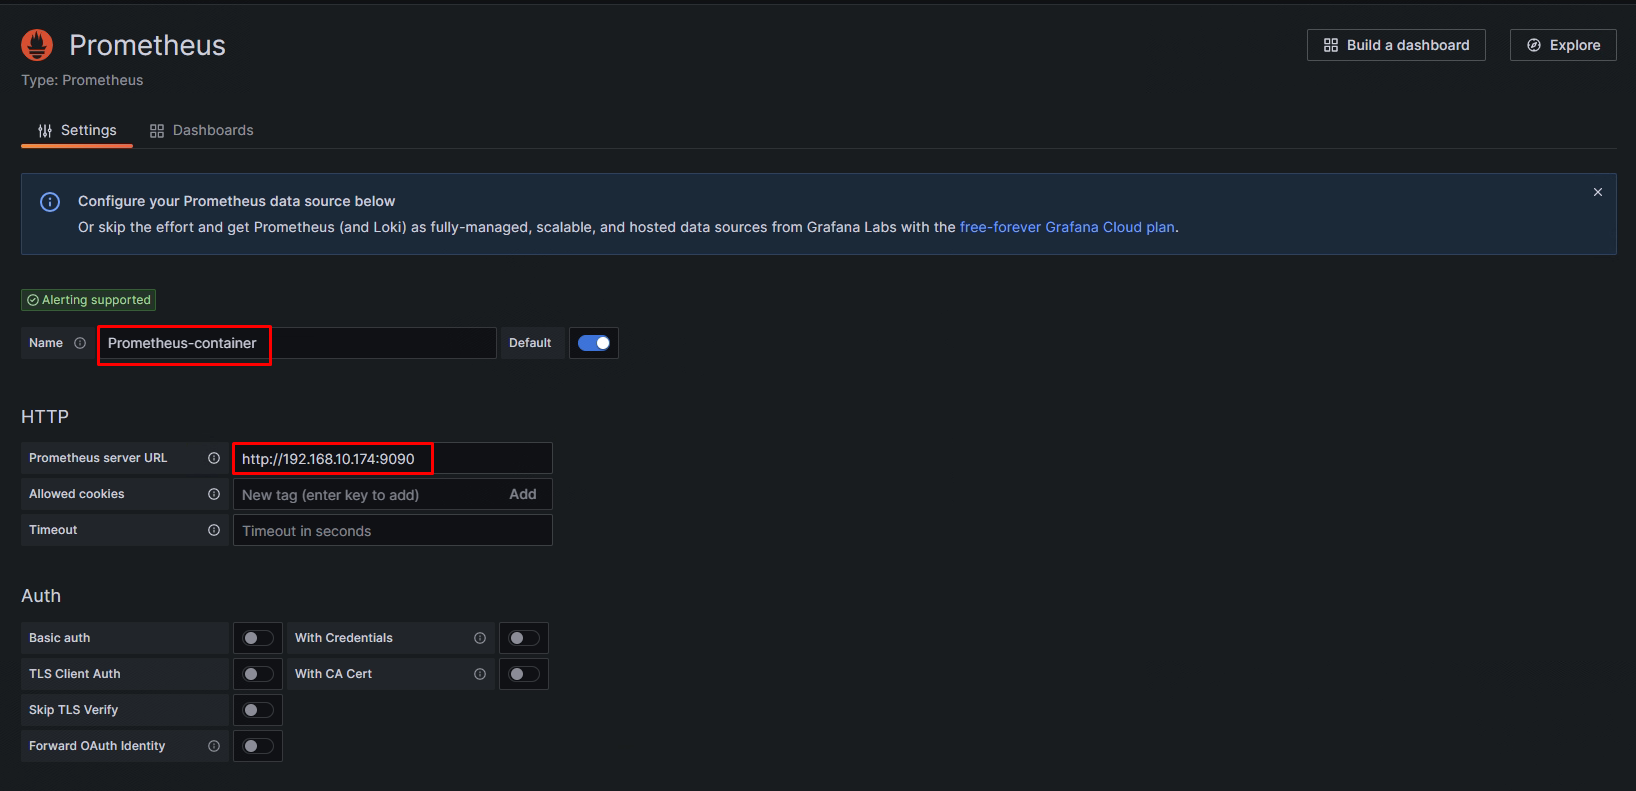
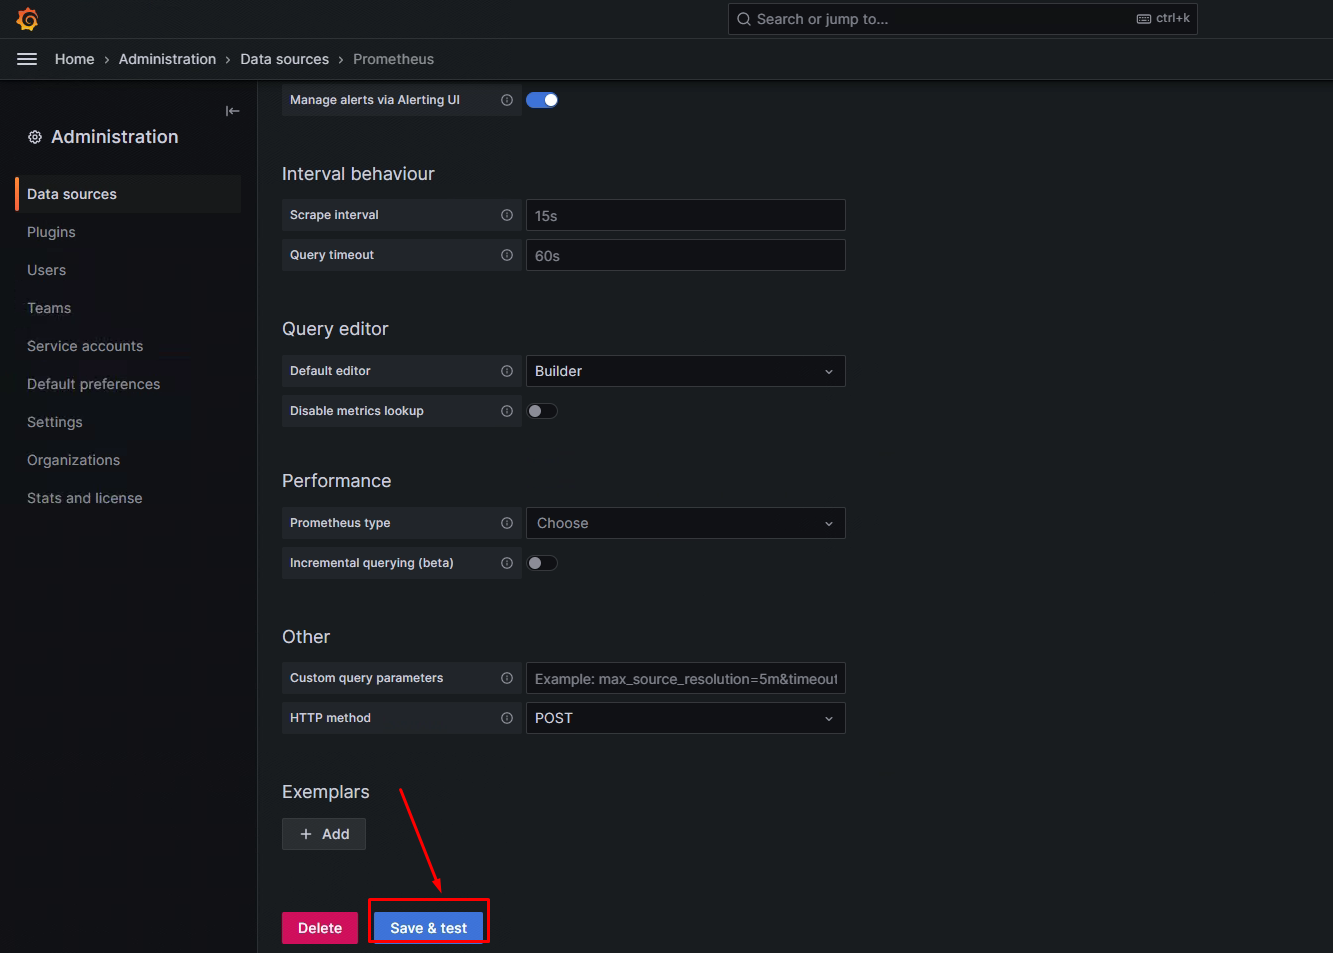
在Grafana添加Prometheus数据源


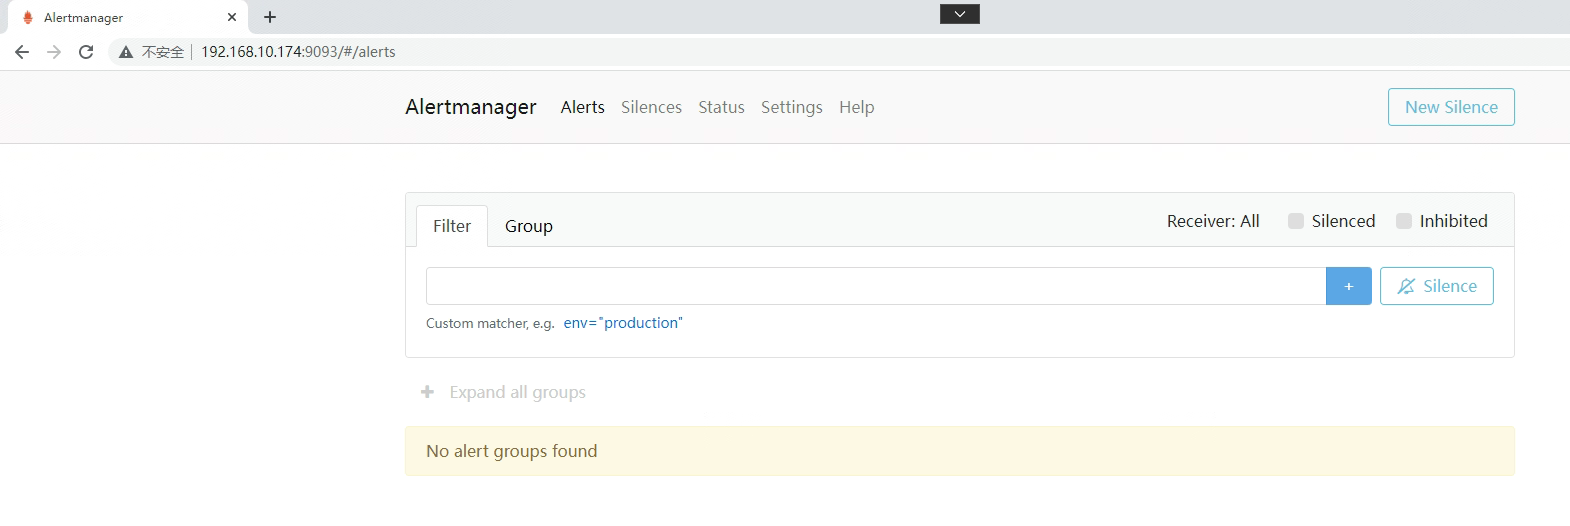
部署Alertmanager
创建持久存储目录
[root@monitorhost ~]# mkdir -p /opt/alertmanager
[root@monitorhost ~]# chmod 777 /opt/alertmanager
准备alertmanager.yml文件
[root@monitorhost ~]# vim /opt/alertmanager/alertmanager.yml
[root@monitorhost ~]# cat /opt/alertmanager/alertmanager.yml
global:
  resolve_timeout: 5m
  smtp_smarthost: 'smtp.126.com:25'
  smtp_from: 'nextgo@126.com'
  smtp_auth_username: 'nextgo@126.com'
  smtp_auth_password: 'RXGFEHFQCLXAMFTP'
  smtp_require_tls: false
route:
  group_by: ['alertname']
  group_wait: 10s
  group_interval: 5m
  repeat_interval: 1m
  receiver: 'mail'
receivers:
- name: 'mail'
  email_configs:
  - to: 'nextgo@126.com'
使用Docker运行Alertmanager
docker run -d \
-p 9093:9093 \
--name alertmanager \
-v /opt/alertmanager/:/etc/alertmanager/ \
-v /etc/localtime:/etc/localtime \
prom/alertmanager:latest \
--config.file=/etc/alertmanager/alertmanager.yml
[root@monitorhost ~]# docker ps
CONTAINER ID   IMAGE                      COMMAND                   CREATED          STATUS          PORTS                                       NAMES
87cbb1e19bb2   prom/alertmanager:latest   "/bin/alertmanager -…"   4 seconds ago    Up 3 seconds    0.0.0.0:9093->9093/tcp, :::9093->9093/tcp   alertmanager
使用容器化构建Prometheus监控系统
在otherhost主机部署node_exporter
安装docker
Docker安装YUM源准备
使用阿里云开源软件镜像站。
# wget https://mirrors.aliyun.com/docker-ce/linux/centos/docker-ce.repo -O /etc/yum.repos.d/docker-ce.repo
Docker安装
# yum -y install docker-ce
启动Docker服务
# systemctl enable --now docker
使用docker运行node_exporter
docker run -d \
-p 9100:9100 \
--restart=always \
--name node-exporter \
-v "/proc:/host/proc:ro" \
-v "/sys:/host/sys:ro" \
-v "/:/rootfs:ro" \
prom/node-exporter:latest
[root@otherhost ~]# docker ps
CONTAINER ID   IMAGE                       COMMAND                CREATED          STATUS          PORTS                                       NAMES
dbf9d1e1edd9   prom/node-exporter:latest   "/bin/node_exporter"   27 seconds ago   Up 26 seconds   0.0.0.0:9100->9100/tcp, :::9100->9100/tcp   node-exporter
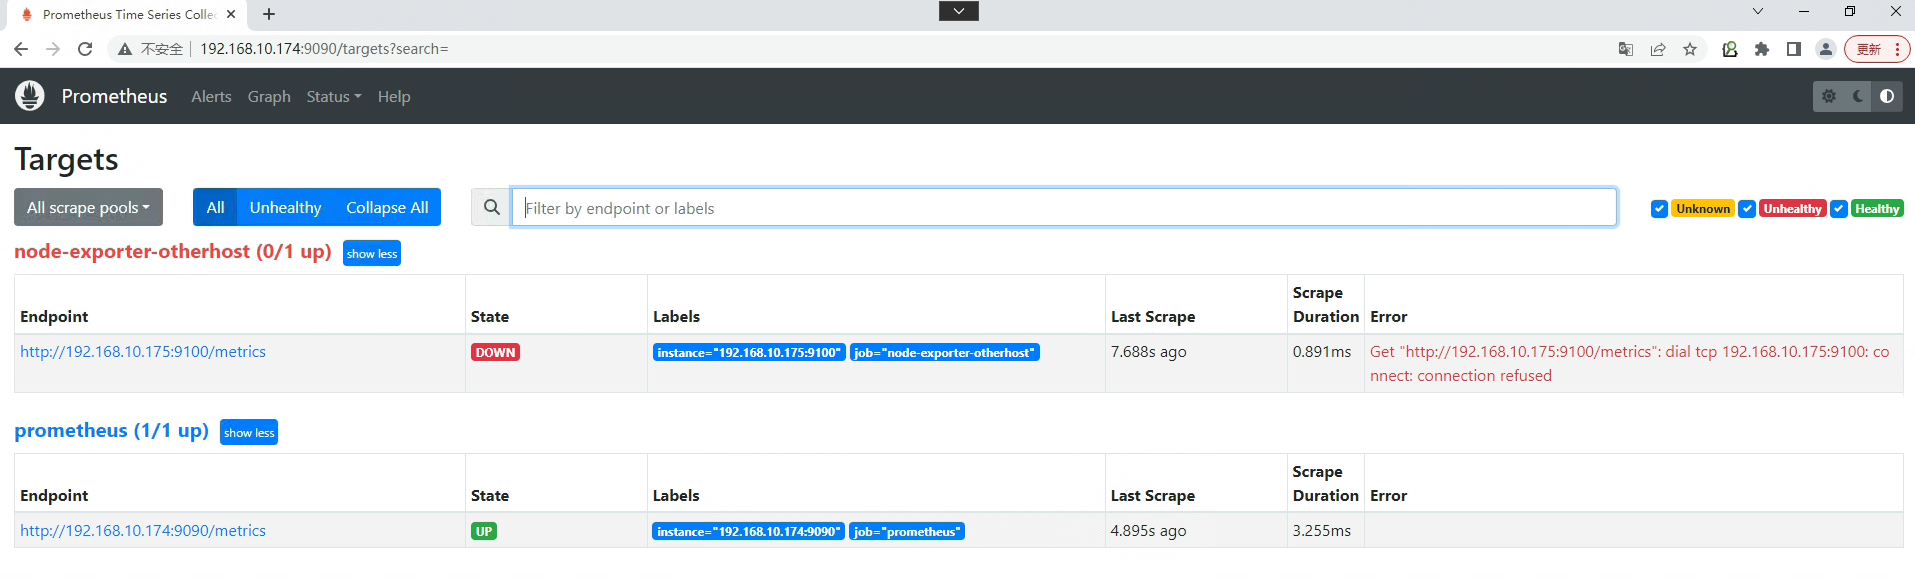
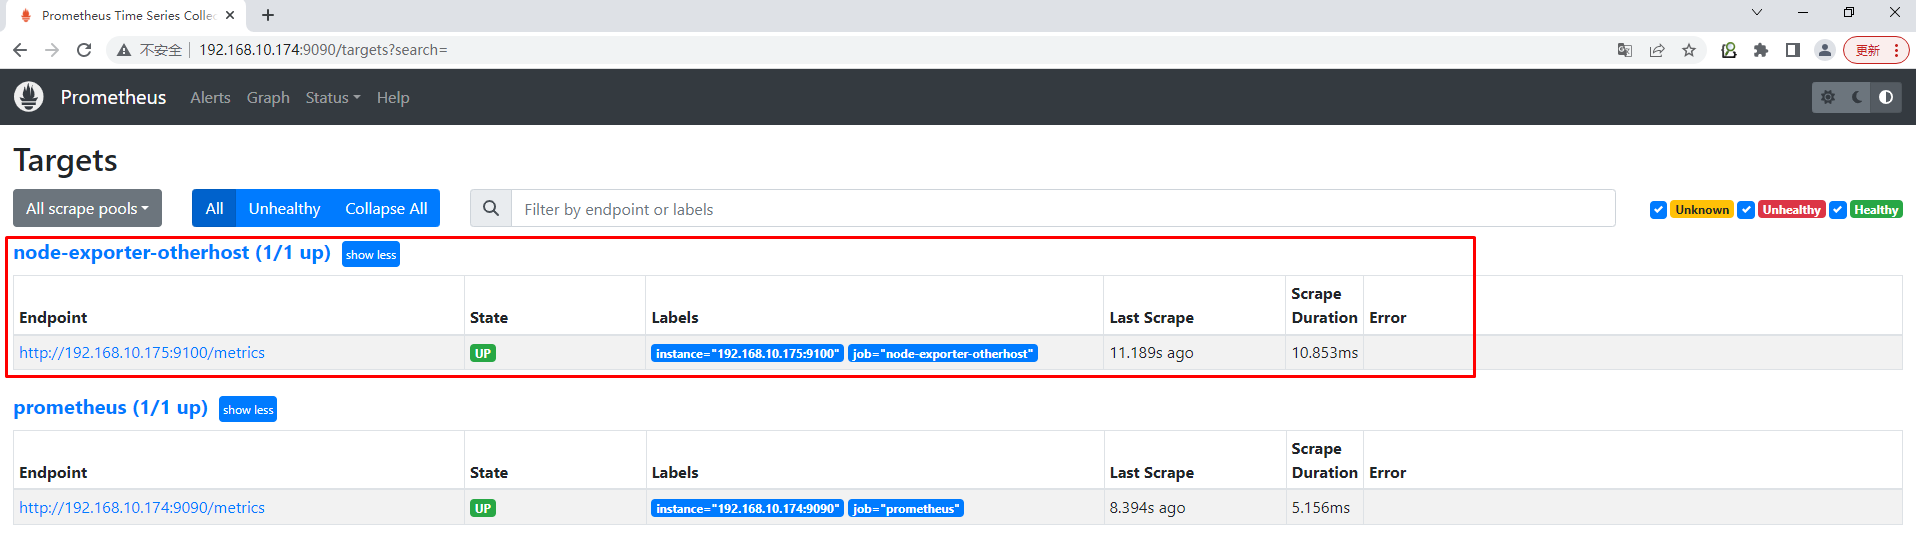
访问
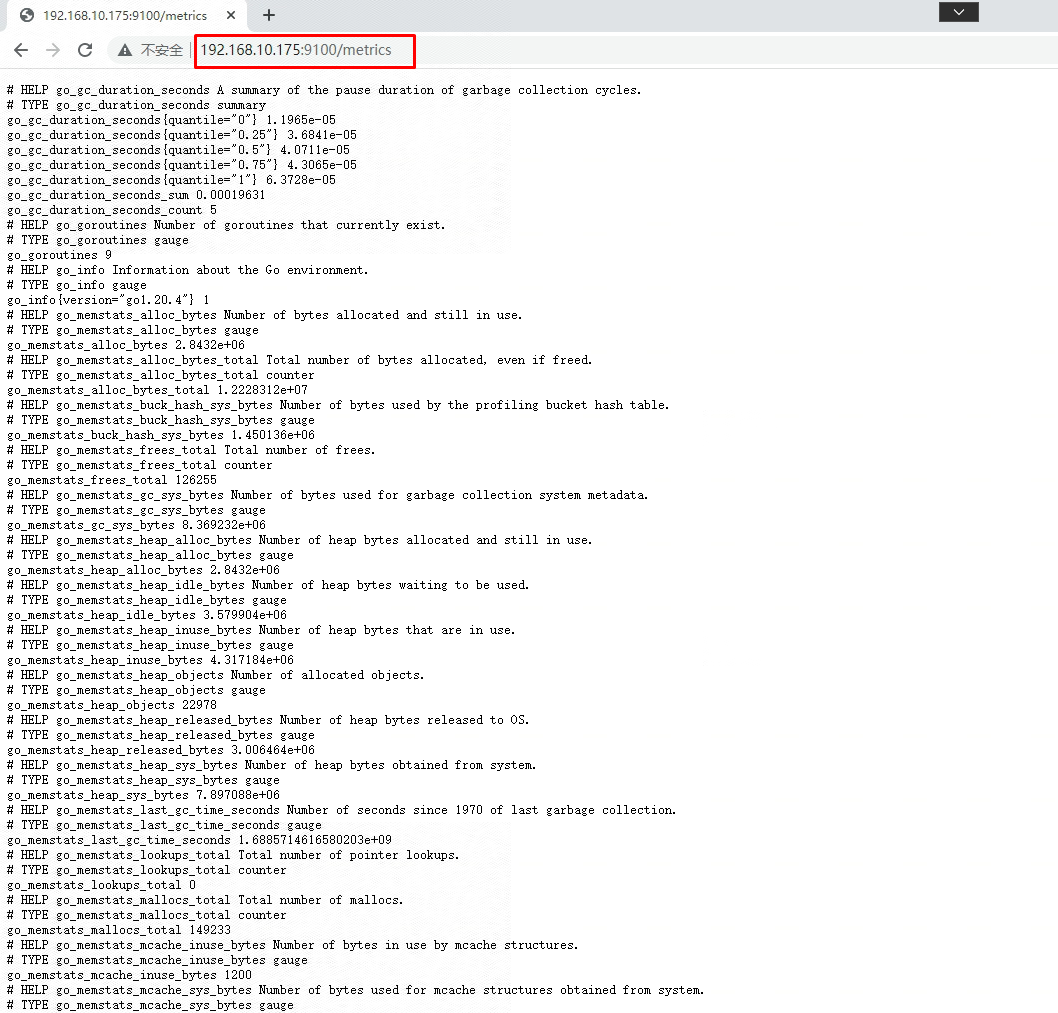
在Prometheus.yml文件中添加otherhost主机
[root@monitorhost ~]# cat /opt/prometheus/config/prometheus.yml
# my global config
global:
  scrape_interval: 15s # Set the scrape interval to every 15 seconds. Default is every 1 minute.
  evaluation_interval: 15s # Evaluate rules every 15 seconds. The default is every 1 minute.
  # scrape_timeout is set to the global default (10s).

# Alertmanager configuration
alerting:
  alertmanagers:
    - static_configs:
        - targets: ['192.168.10.174:9093']
          # - alertmanager:9093

# Load rules once and periodically evaluate them according to the global 'evaluation_interval'.
rule_files:
  # - "first_rules.yml"
  # - "second_rules.yml"
  - "/usr/local/prometheus/rules/*.yml"

# A scrape configuration containing exactly one endpoint to scrape:
# Here it's Prometheus itself.
scrape_configs:
  # The job name is added as a label `job=<job_name>` to any timeseries scraped from this config.
  - job_name: "prometheus"

    # metrics_path defaults to '/metrics'
    # scheme defaults to 'http'.

    static_configs:
      - targets: ["192.168.10.174:9090"]

  - job_name: "node-exporter-otherhost"
    static_configs:
      - targets: ["192.168.10.175:9100"]
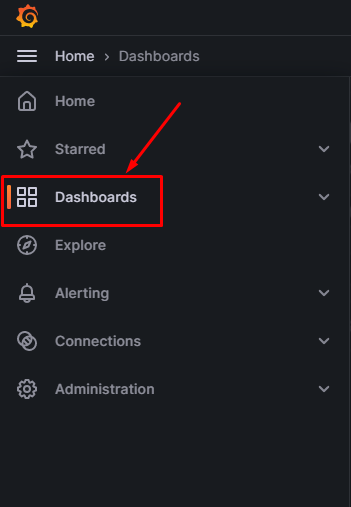
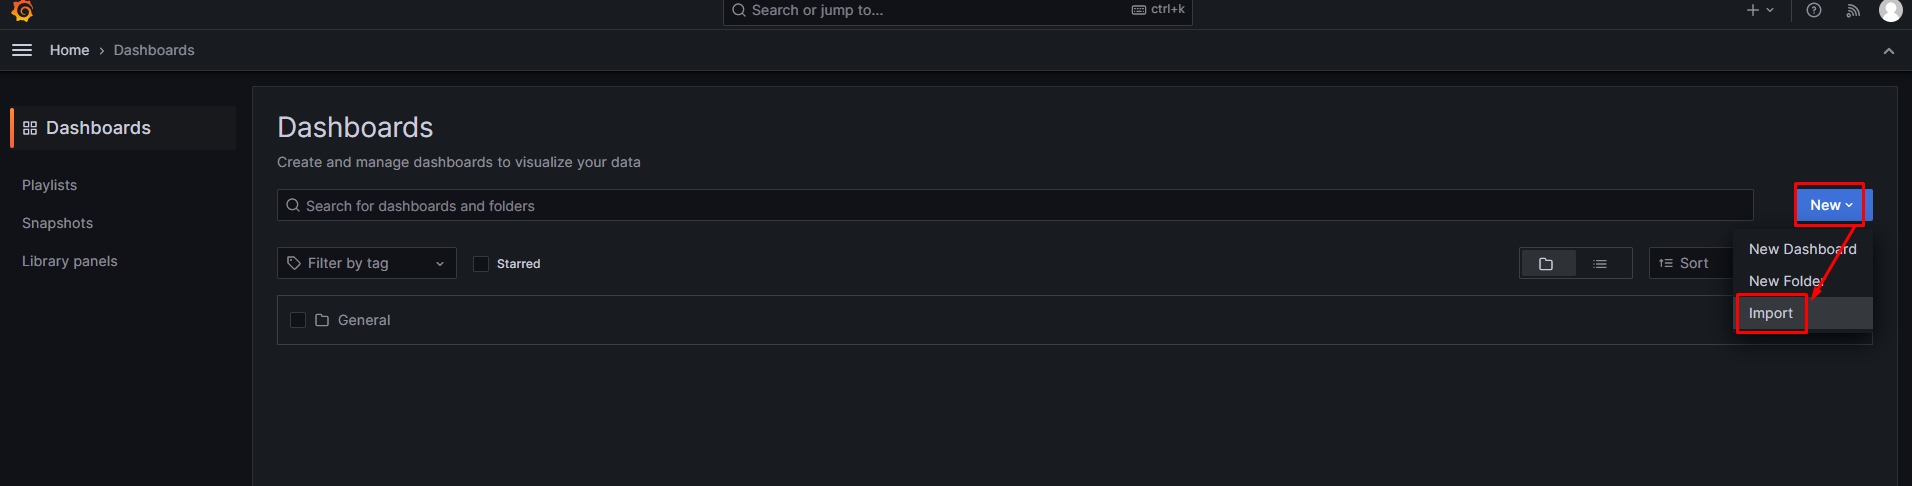
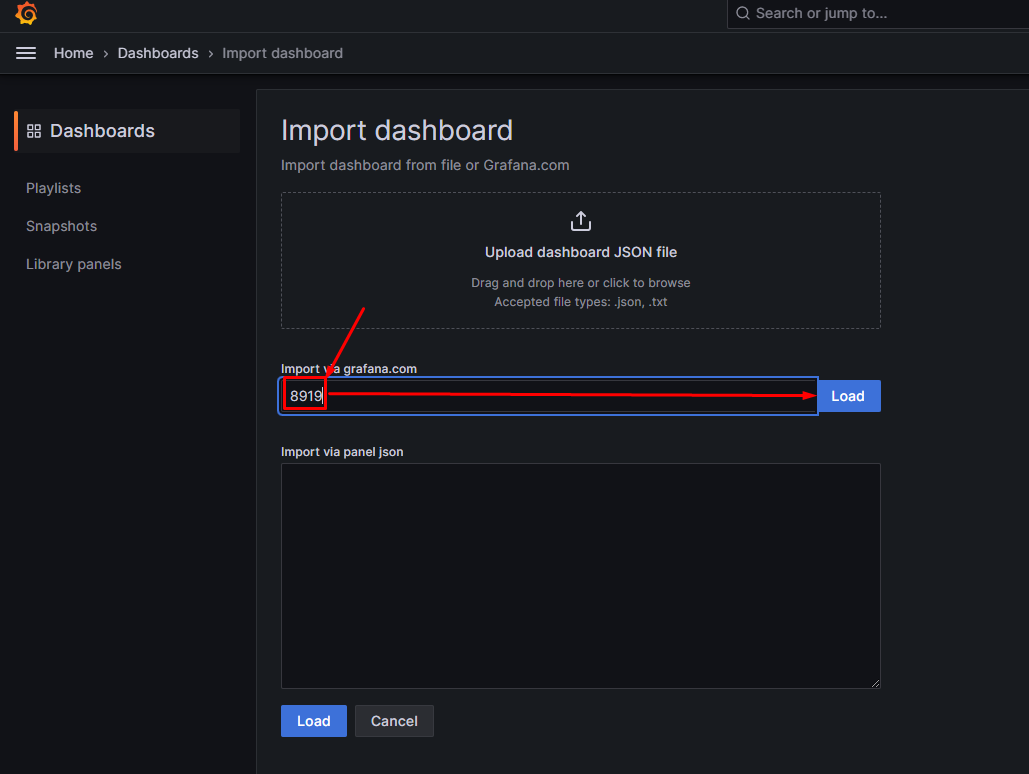
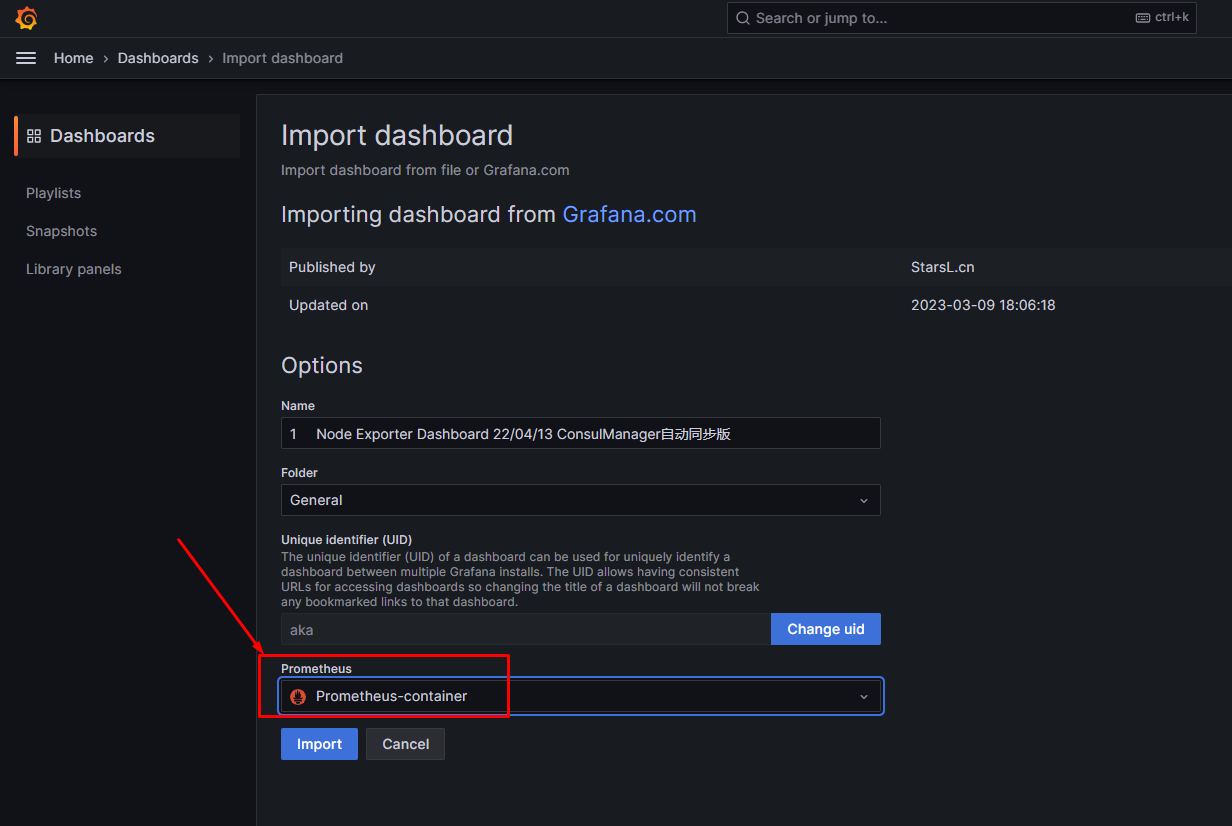
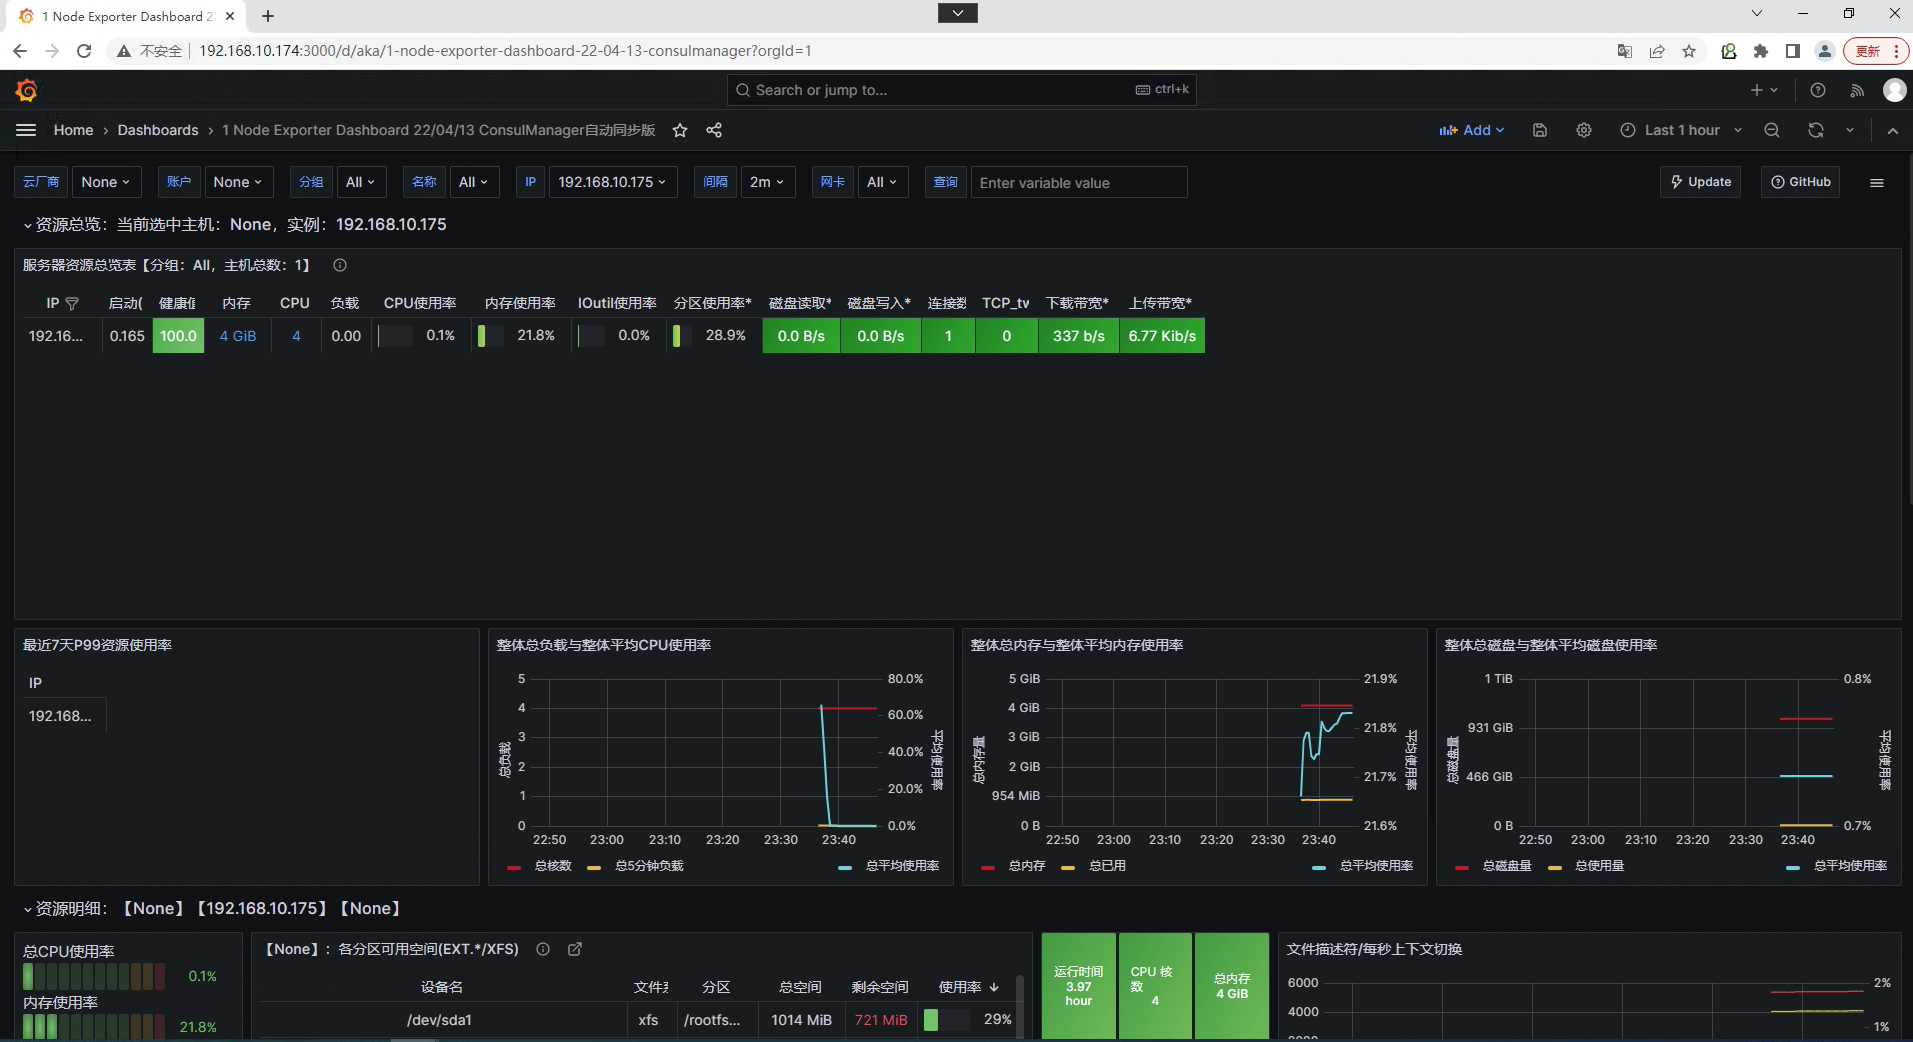
在Grafana中展示otherhost主机监控dashboard
通过Alertmanager实现邮件告警
在Prometheus.yml文件加添加Alertmanager连接配置
[root@monitorhost ~]# cat /opt/prometheus/config/prometheus.yml
# my global config
global:
  scrape_interval: 15s # Set the scrape interval to every 15 seconds. Default is every 1 minute.
  evaluation_interval: 15s # Evaluate rules every 15 seconds. The default is every 1 minute.
  # scrape_timeout is set to the global default (10s).

# Alertmanager configuration
alerting:
  alertmanagers:
    - static_configs:
        - targets: ['192.168.10.174:9093'] 添加此处内容
          # - alertmanager:9093

# Load rules once and periodically evaluate them according to the global 'evaluation_interval'.
rule_files:
  # - "first_rules.yml"
  # - "second_rules.yml"
  - "/usr/local/prometheus/rules/*.yml"

# A scrape configuration containing exactly one endpoint to scrape:
# Here it's Prometheus itself.
scrape_configs:
  # The job name is added as a label `job=<job_name>` to any timeseries scraped from this config.
  - job_name: "prometheus"

    # metrics_path defaults to '/metrics'
    # scheme defaults to 'http'.

    static_configs:
      - targets: ["192.168.10.174:9090"]

  - job_name: "node-exporter-otherhost"
    static_configs:
      - targets: ["192.168.10.175:9100"]
为Prometheus添加告警规则
[root@monitorhost ~]# cat /opt/prometheus/config/prometheus.yml
# my global config
global:
  scrape_interval: 15s # Set the scrape interval to every 15 seconds. Default is every 1 minute.
  evaluation_interval: 15s # Evaluate rules every 15 seconds. The default is every 1 minute.
  # scrape_timeout is set to the global default (10s).

# Alertmanager configuration
alerting:
  alertmanagers:
    - static_configs:
        - targets: ['192.168.10.174:9093']
          # - alertmanager:9093

# Load rules once and periodically evaluate them according to the global 'evaluation_interval'.
rule_files:
  # - "first_rules.yml"
  # - "second_rules.yml"
  - "/usr/local/prometheus/rules/*.yml" 在此目录中添加告警规则文件

# A scrape configuration containing exactly one endpoint to scrape:
# Here it's Prometheus itself.
scrape_configs:
  # The job name is added as a label `job=<job_name>` to any timeseries scraped from this config.
  - job_name: "prometheus"

    # metrics_path defaults to '/metrics'
    # scheme defaults to 'http'.

    static_configs:
      - targets: ["192.168.10.174:9090"]

  - job_name: "node-exporter-otherhost"
    static_configs:
      - targets: ["192.168.10.175:9100"]
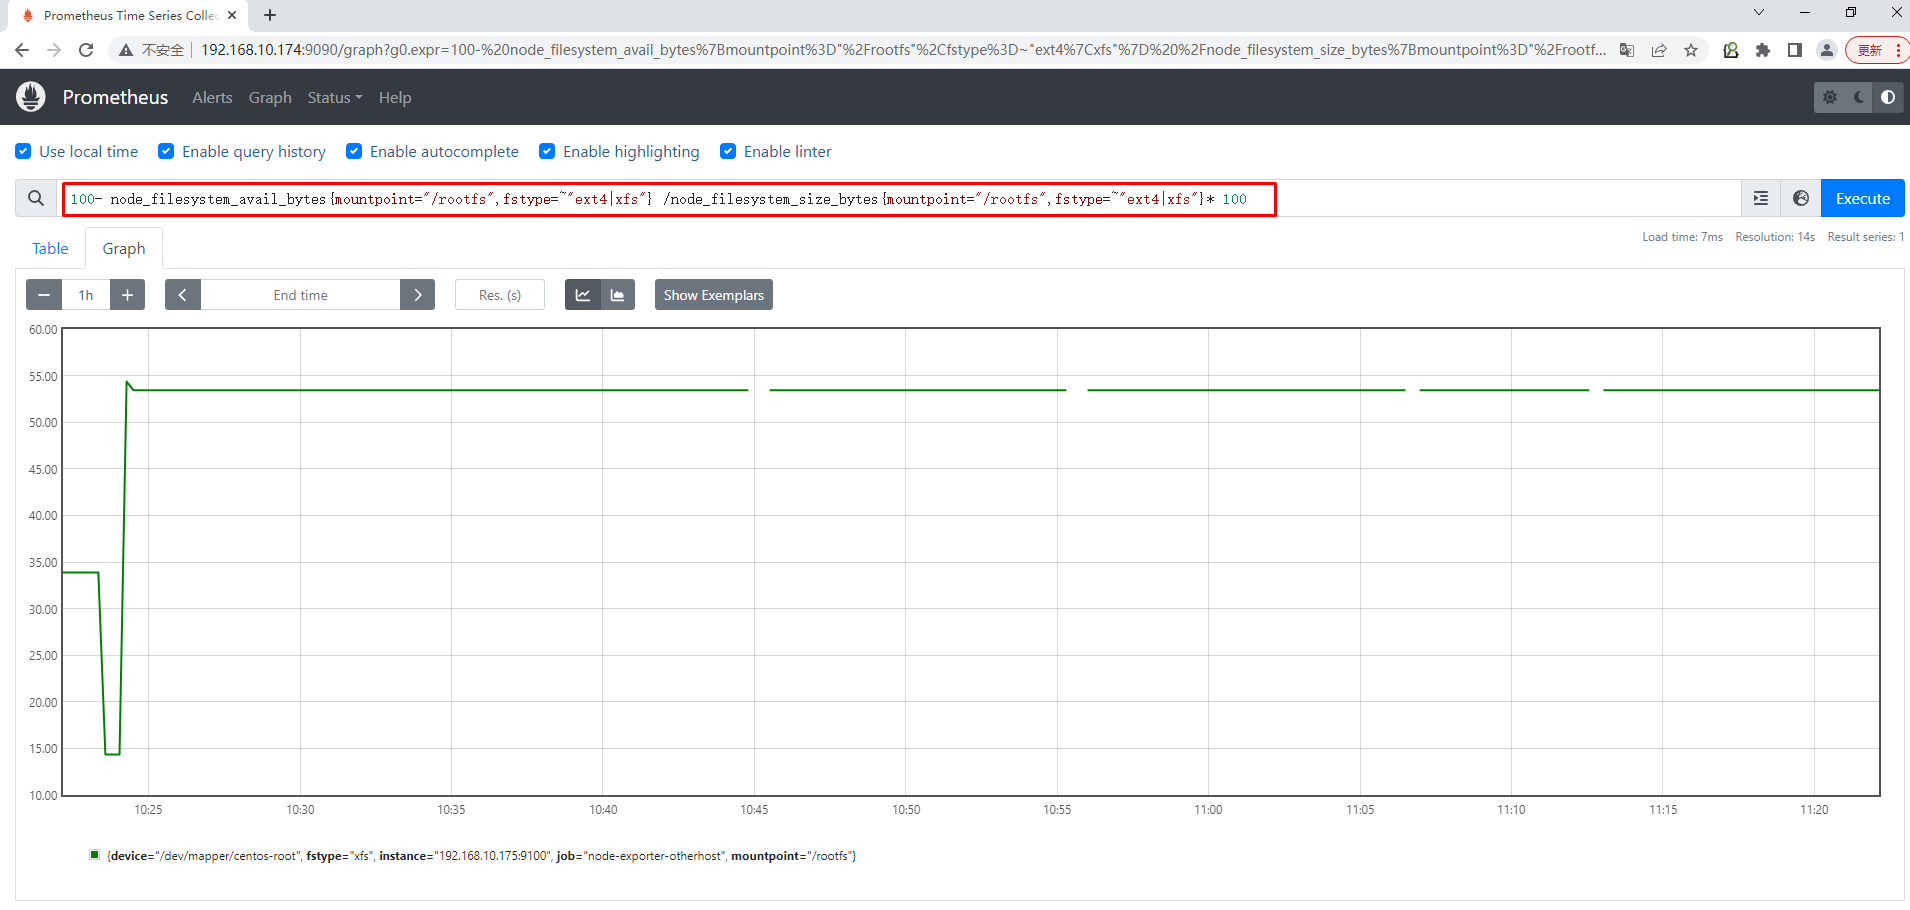
使用PromQL查询:100- node_filesystem_avail_bytes{mountpoint="/rootfs",fstype=~"ext4|xfs"} /node_filesystem_size_bytes{mountpoint="/rootfs",fstype=~"ext4|xfs"}* 100
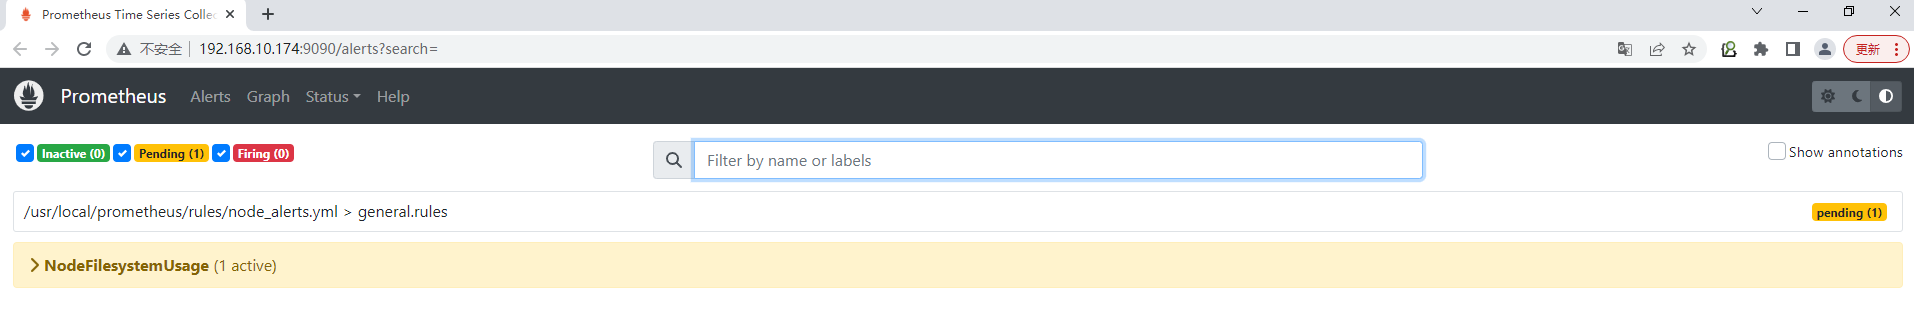
[root@monitorhost ~]# vim /opt/prometheus/rules/node_alerts.yml
[root@monitorhost ~]# cat /opt/prometheus/rules/node_alerts.yml
groups:
- name: general.rules
rules:
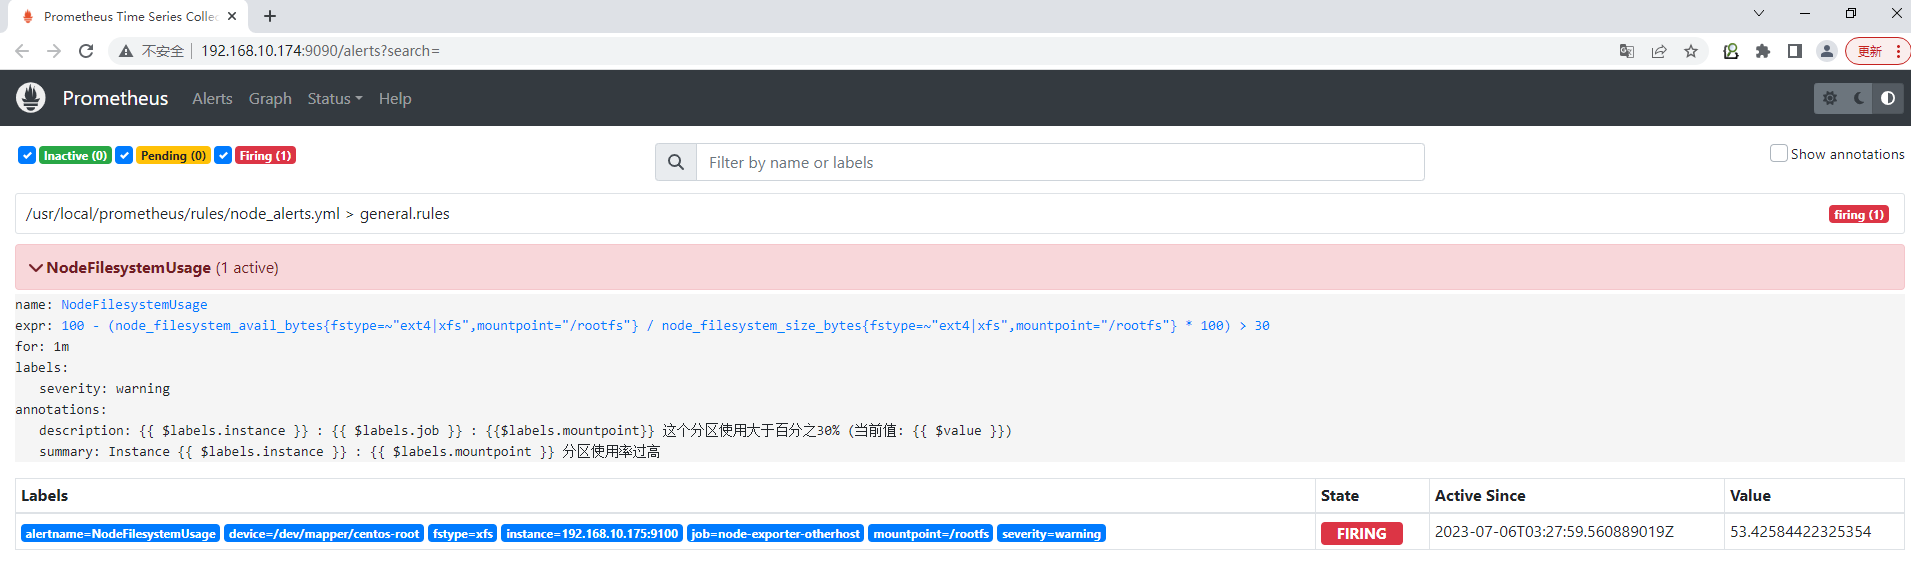
- alert: NodeFilesystemUsage
expr: 100 - (node_filesystem_free_bytes{mountpoint="/rootfs",fstype=~"ext4|xfs"} / node_filesystem_size_bytes{mountpoint="/rootfs",fstype=~"ext4|xfs"} * 100) > 30
for: 1m
labels:
severity: warning
annotations:
summary: "Instance {{ $labels.instance }} : {{ $labels.mountpoint }} 分区使用率过高"
description: "{{ $labels.instance }} : {{ $labels.job }} : {{$labels.mountpoint}} 这个分区使用大于百分之30% (当前值: {{ $value }})"
[root@monitorhost ~]# docker ps
CONTAINER ID   IMAGE                      COMMAND                   CREATED             STATUS             PORTS                                       NAMES
87cbb1e19bb2   prom/alertmanager:latest   "/bin/alertmanager -…"   About an hour ago   Up About an hour   0.0.0.0:9093->9093/tcp, :::9093->9093/tcp   alertmanager
21fb83ee6e55   grafana/grafana:latest     "/run.sh"                 2 hours ago         Up 2 hours         0.0.0.0:3000->3000/tcp, :::3000->3000/tcp   grafana
bf65c67833bb   prom/prometheus:latest     "/bin/prometheus --s…"   3 hours ago         Up 3 hours         0.0.0.0:9090->9090/tcp, :::9090->9090/tcp   recursing_brattain

[root@monitorhost ~]# docker restart bf65c67833bb
bf65c67833bb
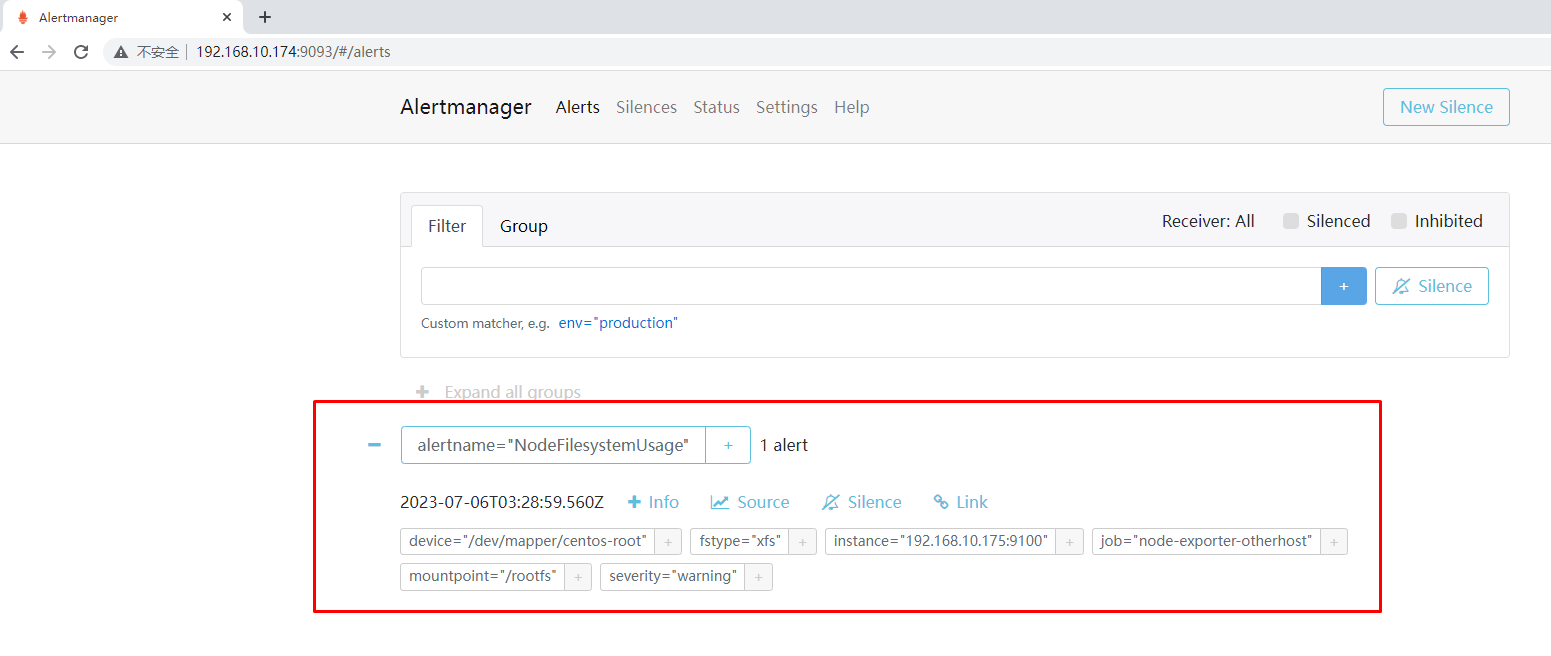
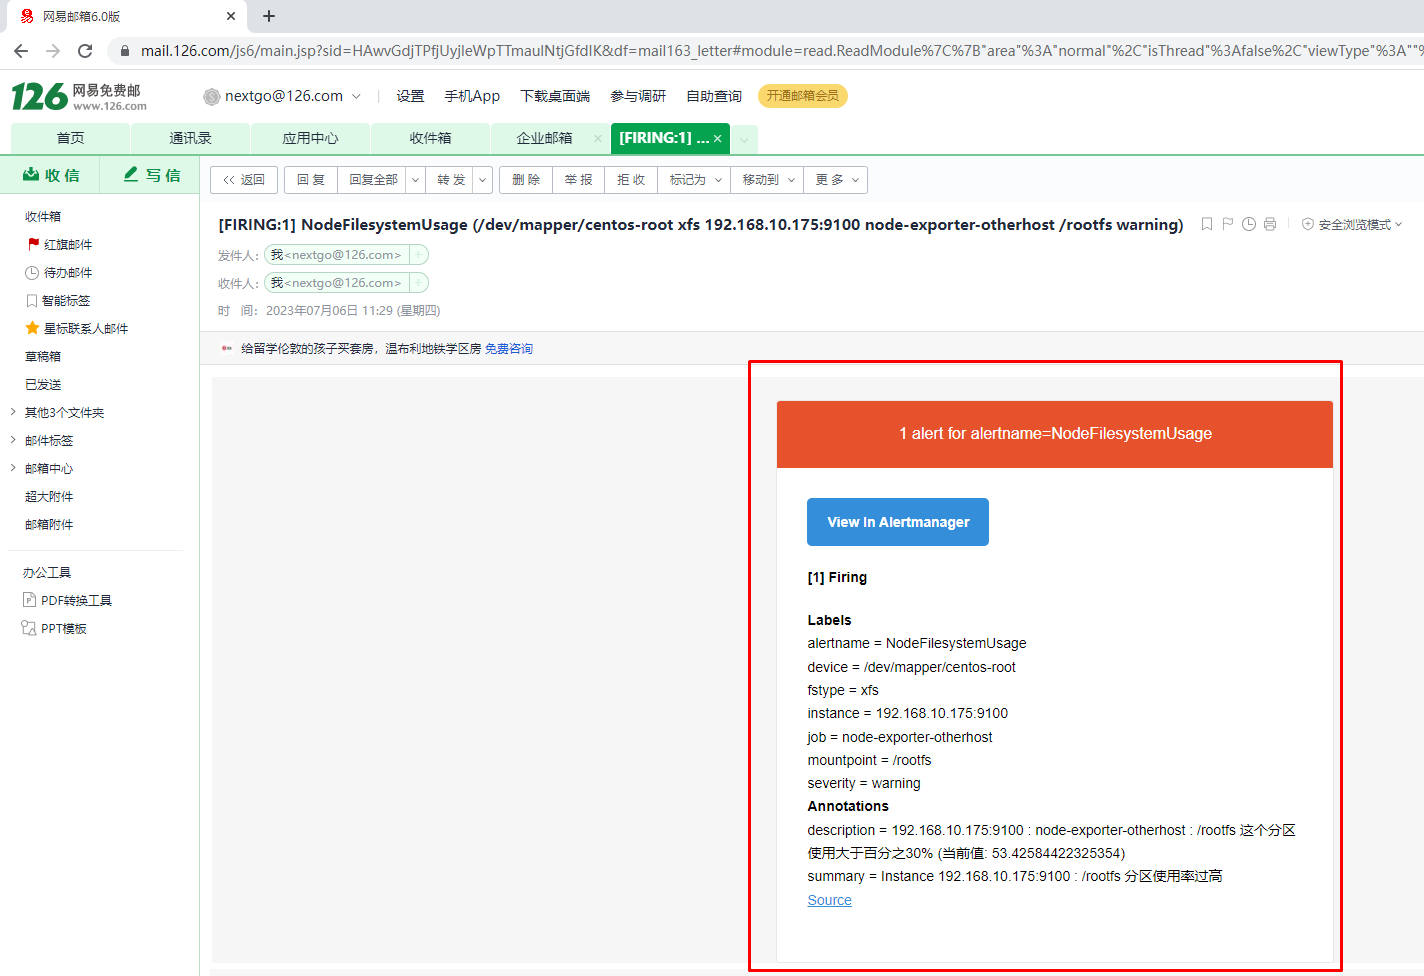
为Alertmanager配置告警渠道
[root@monitorhost ~]# vim /opt/alertmanager/alertmanager.yml
[root@monitorhost ~]# cat /opt/alertmanager/alertmanager.yml
global:
  resolve_timeout: 5m
  smtp_smarthost: 'smtp.126.com:25'
  smtp_from: 'nextgo@126.com'
  smtp_auth_username: 'nextgo@126.com'
  smtp_auth_password: 'RXGFEHFQCLXAMFTP'
  smtp_require_tls: false
route:
  group_by: ['alertname']
  group_wait: 10s
  group_interval: 5m
  repeat_interval: 1m
  receiver: 'mail'
receivers:
- name: 'mail'
  email_configs:
  - to: 'nextgo@126.com'
验证告警可用性
[root@otherhost ~]# df -h
文件系统                 容量  已用  可用 已用% 挂载点
devtmpfs                 1.9G     0  1.9G    0% /dev
tmpfs                    2.0G     0  2.0G    0% /dev/shm
tmpfs                    2.0G  9.8M  1.9G    1% /run
tmpfs                    2.0G     0  2.0G    0% /sys/fs/cgroup
/dev/mapper/centos-root   50G  7.2G   43G   15% /
/dev/sda1               1014M  293M  722M   29% /boot
/dev/mapper/centos-home  969G   33M  969G    1% /home
tmpfs                    391M   12K  391M    1% /run/user/42
tmpfs                    391M     0  391M    0% /run/user/0
overlay                   50G  7.2G   43G   15% /var/lib/docker/overlay2/f06a8ba0d164f356d75e02f17834984e397995780e3751d302d0204ba8b80121/merged
[root@otherhost ~]# dd if=/dev/zero of=/test1 bs=1M count=10000
[root@otherhost ~]# df -h
文件系统                 容量  已用  可用 已用% 挂载点
devtmpfs                 1.9G     0  1.9G    0% /dev
tmpfs                    2.0G     0  2.0G    0% /dev/shm
tmpfs                    2.0G  9.8M  1.9G    1% /run
tmpfs                    2.0G     0  2.0G    0% /sys/fs/cgroup
/dev/mapper/centos-root   50G   17G   34G   34% /
/dev/sda1               1014M  293M  722M   29% /boot
/dev/mapper/centos-home  969G   33M  969G    1% /home
tmpfs                    391M   12K  391M    1% /run/user/42
tmpfs                    391M     0  391M    0% /run/user/0
overlay                   50G   17G   34G   34% /var/lib/docker/overlay2/f06a8ba0d164f356d75e02f17834984e397995780e3751d302d0204ba8b80121/merged